
Where do greenhouse gas emissions come from?
Submitted by Camille Démo ✓, Collège Jean-Moulin, Paris · published on September 17, 2026
Read a data table on global greenhouse gas emissions by sector, compute percentage shares and build a bar chart.
Exercise
In 2019, human activities released about 59 billion tonnes of CO2-equivalent greenhouse gases. The table shows how these emissions were split between sectors (rounded figures from the IPCC Sixth Assessment Report).
| Sector | Emissions (Gt CO2-eq) |
|---|---|
| Energy supply (electricity, heat, fuels) | 20 |
| Industry | 14 |
| Agriculture, forestry and land use | 13 |
| Transport | 9 |
| Buildings (direct emissions) | 3 |
Check that the total matches the 59 Gt announced in the text.
Calculate the share of each sector as a percentage of the total. Round to the nearest whole number.
Draw a bar chart of the five sectors, in decreasing order. Choose a scale and label the axes.
Transport emissions are expected to keep rising. If they reached 12 Gt while the other sectors stayed the same, what would the new total be, and what would the transport share become?
A classmate says: “Buildings are only 5 %, so insulating homes is useless.” Give one argument for and one argument against this statement.
Show the answer key
20 + 14 + 13 + 9 + 3 = 59 Gt.
Energy supply 20 / 59 ≈ 34 %; industry 14 / 59 ≈ 24 %; agriculture, forestry and land use 13 / 59 ≈ 22 %; transport 9 / 59 ≈ 15 %; buildings 3 / 59 ≈ 5 %. The rounded shares add up to 100 %.
Bars in the order energy supply, industry, agriculture, transport, buildings. A scale of 1 cm for 2 Gt keeps the tallest bar at 10 cm. Axes: sectors horizontally, Gt CO2-eq vertically.
New total 20 + 14 + 13 + 12 + 3 = 62 Gt; transport share 12 / 62 ≈ 19 %.
For: 5 % is the smallest share, so the direct gain is limited. Against: 3 Gt is still enormous, comparable to the emissions of the whole European Union; the electricity and heat used in buildings are counted under “energy supply”, so better insulation also cuts that sector; and insulation lowers energy bills whatever the climate benefit.
Show the 2 quiz questions
Multiple-choice questions about the climate topic of this exercise. Mark the exercise as done with a class to add them to that class's quiz.
Which sector is the largest source of greenhouse gas emissions worldwide?
- A. Transport
- B. Energy supply (electricity, heat, fuels) ✓
- C. Buildings
- D. Agriculture
What does “CO₂-equivalent” mean?
- A. Only CO₂ is counted
- B. All greenhouse gases are converted into the amount of CO₂ with the same warming effect ✓
- C. The amount of CO₂ absorbed by forests
- D. CO₂ measured at the equator
To go further
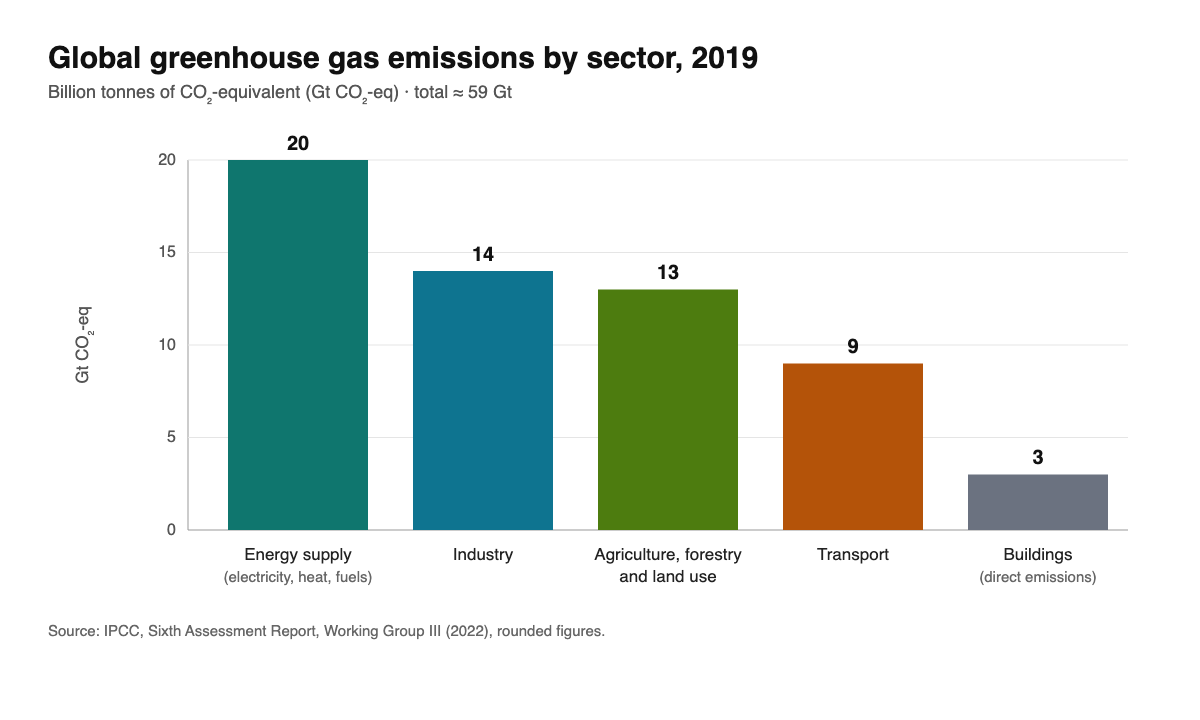
The IPCC groups emissions into five sectors. “Energy supply” means producing electricity, heat and fuels; it is the largest source because most of the world still burns coal, oil and gas to generate power. The chart below shows the same data as the table.
Key ideas
Direct and indirect emissions. Only the fuel burned inside a building counts as “buildings”. Once the electricity and heat it consumes are attributed to it, the buildings sector is closer to 16 % of the total.
CO2-equivalent. Methane and nitrous oxide are converted into the amount of CO2 that would have the same warming effect over 100 years, so that all gases can be added up.
Where to look next. The IPCC Working Group III report (Summary for Policymakers, figure SPM.2) is the source of these figures. Our World in Data publishes the same breakdown by country.
Comments
No comments yet. Tried this exercise in class? Tell other teachers how it went.
Log in with your teacher account to comment.
Log in